Using Data to Shape Seasonal Exhibition Schedules
Seasonal exhibition schedules can benefit from careful analysis of attendance patterns, local calendars, and programming outcomes. Data-guided timing helps organizers align exhibitions, festivals, and performances with audience availability while preserving curatorial intent and creative experimentation.

Seasonal planning for exhibitions requires balancing artistic goals with audience behavior, operational capacity, and external events. By tracking visitor flows, ticketing trends, local festival dates, and engagement with multimedia installations, institutions can choose windows that maximize relevance without compromising curation. Data does not replace creative judgment; it supplements programming decisions with evidence that helps reduce conflict between events, supports outreach efforts, and informs staffing and technical needs in peak periods.
How does data inform exhibition programming?
Audience analytics reveal which themes and formats resonate over time. Museums and galleries can compare attendance across past seasons, noting when family programs or experimental installations drew interest. Ticketing, time-slot uptake, and dwell-time metrics show when visitors prefer longer-form exhibitions versus quick visits. Programming informed by this evidence can stagger openings, align educational workshops with peak days, and tailor hours to capture varied visitor patterns while retaining a coherent curatorial narrative.
How can data shape audience outreach?
Segmentation of visitor data—age groups, repeat visitors, referral channels—helps outreach teams target messaging and choose the best timing for campaigns. Geolocation and survey feedback clarify where outreach is most effective, including partnerships with local services and community groups. Combining digital engagement metrics with on-site observations supports scheduling marketing bursts before anticipated high-attendance weekends and creating tailored offers that match audience interests, enhancing both attendance quality and inclusivity.
What trends link culture and creativity?
Tracking cultural trends across seasons can guide the selection of projects that reflect the community’s creative interests. Social listening, local event calendars, and collaborator feedback identify themes that intersect with broader cultural moments. Data can highlight when a particular cultural conversation is peaking, enabling curators to schedule exhibitions that engage with current creativity without appearing opportunistic. This approach helps maintain cultural relevance while supporting experimental or long-lead creative works.
How to schedule festivals and performances?
Festivals and live performances involve multiple moving parts: artist availability, technical needs, and audience habits. Historical attendance trends and survey data inform ideal days and times for performances, while analysis of competing events in the area prevents scheduling clashes. Using data to map peak and off-peak windows allows organizers to distribute headline acts across a season, optimize staffing, and sequence complementary programming so that installations and performances enhance rather than compete with one another.
How can multimedia and installation respond to data?
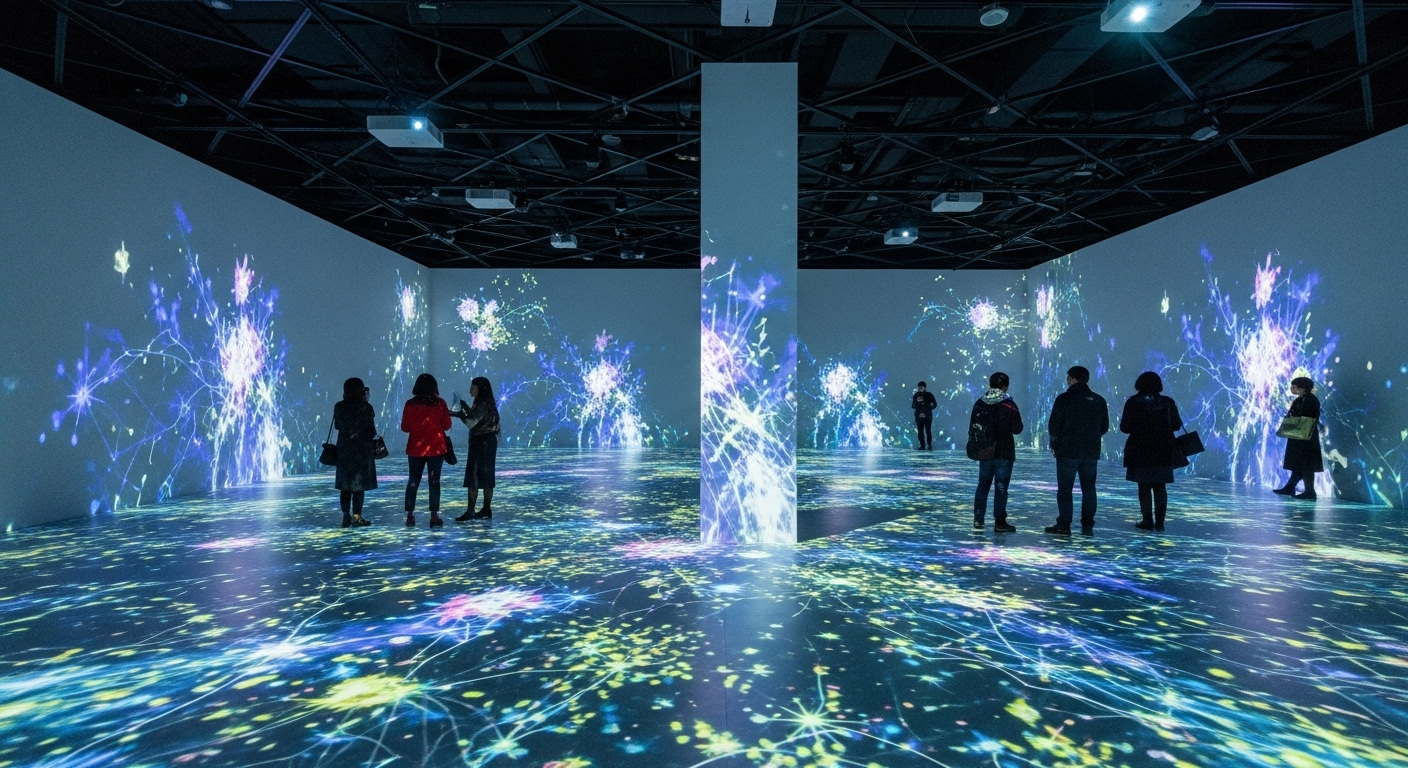
Multimedia and installation works often require specialized infrastructure and controlled audiences. Data on dwell times, flow patterns, and repeat visits indicates which installations benefit from extended runs versus shorter, intensive engagements. Technical analytics—sensor uptime, interactive engagements, and playback metrics—can inform maintenance windows and scheduling so installations remain reliable during predicted peak attendance. This reduces downtime and ensures storytelling elements function as intended for the largest possible audience.
How does curation use storytelling and metrics?
Curation blends narrative design with audience insight: metrics highlight which story arcs captivate visitors and which elements provoke engagement. Ticketing funnels, gallery heatmaps, and post-visit feedback help curators refine interpretive strategies, balancing didactic material with interactive storytelling. Data enables testing of hypotheses—such as whether thematic clusters increase cross-gallery movement—and supports iterative programming choices that preserve artistic integrity while improving visitor comprehension and satisfaction.
Seasonal schedules built on thoughtful data analysis do not standardize creativity; they create conditions where culture, programming, and community engagement can thrive together. Combining quantitative patterns with qualitative feedback gives curators and programmers the context to sequence exhibitions, plan festivals, and manage installations in ways that respect artistic goals and audience needs. Responsible use of data supports sustainable operations, encourages diverse storytelling approaches, and helps institutions design seasons that reflect both creative ambition and real-world behavior.


